Science + Society
Impartial
Machine
Impartial
Machine
Impartial Machine
Impartial
Machine
From voice assistants to image recognition, fraud detection to social media feeds, machine learning (ML) and artificial intelligence (AI) are becoming an increasingly important part of society. The two fields have made enormous strides in recent years thanks to gains in computing power and the so-called “information explosion.” Such algorithms are being used in fields as varied as medicine, agriculture, insurance, transportation and art, and the number of companies rushing to embrace what ML and AI can offer has increased rapidly in recent years.
According to a survey conducted by Teradata in July 2017, 80% of enterprises have already begun investing in AI technologies and 30% plan to increase their spending over the next 36 months. Investment in such models is also forecasted to grow from $12 billion in 2017 to over $50 billion by 2021. Billed as being more accurate, consistent and objective than human judgment, the promises and expectations of what ML and AI can achieve have never been greater.
Artificial intelligence and machine learning are often used interchangeably but there are in fact differences between the two.
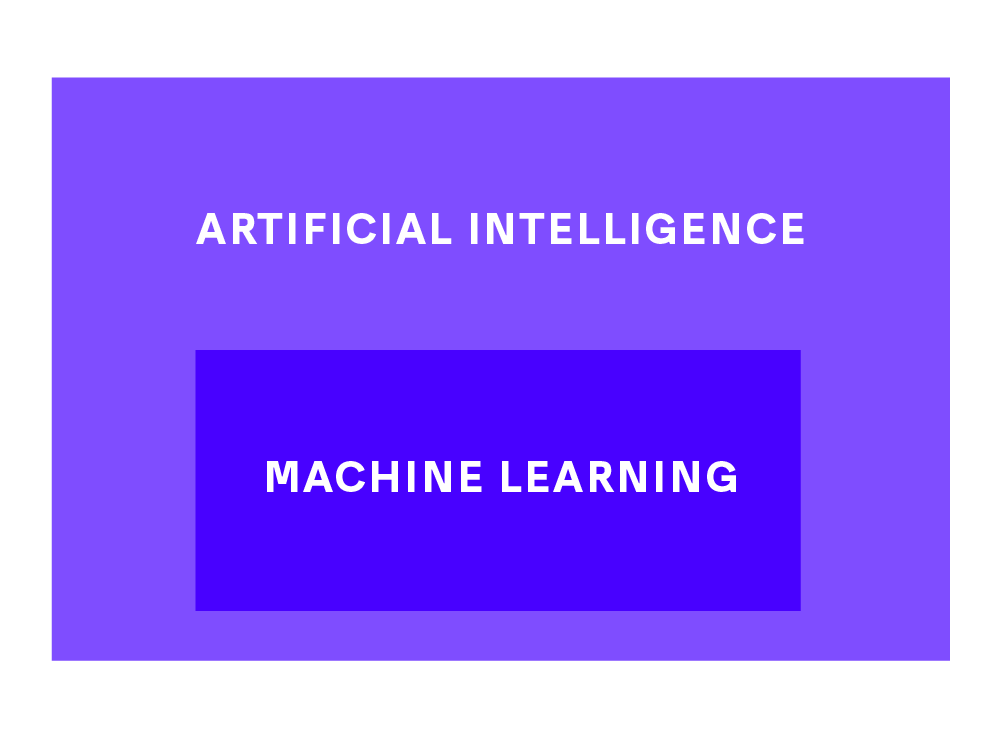
Artificial intelligence refers to the broader science of getting computers to act intelligently without being explicitly programmed.
Machine learning is the use of statistical algorithms to detect patterns in large datasets. It is one way in which computers can become better at a task and thus considered to be a subset of artificial intelligence.
However, for every neural network that can defeat Jeopardy champions and outplay Go masters, there are other well-documented instances where these algorithms have produced highly disturbing results. Facial-analysis programs were found to have an error rate of 20 to 34 percent when trying to determine the gender of African-American women compared to an error rate of less than one percent for white men. ML algorithms used to predict which criminals are most likely to reoffend tended to incorrectly flag black defendants as being high risk at twice the rate of white defendants. A word embedding model used to help machines determine the meaning of words based on their similarity likewise associated men with being computer programmers and women with homemakers.
If data-trained models are supposed to be objective and impartial, how did these algorithms get things so wrong? Can such bias be fixed?
The Machine Learning Pipeline
Being able to use data to meaningfully answer questions via machine learning requires several steps. Before getting into the details of bias, it is important to understand them.
- Data gathering. All machine learning models require data as inputs. In today’s increasingly digitized world, data can be derived from various sources including user interactions on a website, collections of photo images and sensor recordings.
- Data preparation. Data collected are rarely in a usable state as-is. Data often need to be cleaned, transformed and checked for errors before they are ready to be fed into a model.
- Split dataset into training and testing sets. The training dataset is used to build and train the model while the testing dataset, which is kept separate, is used to evaluate how well the model performs. It is important to assess the model on data it has not seen before in order to ensure that it has indeed learned something about the underlying structure of the data rather than simply “memorized” the training data.
- Fit and train models. This is the step where various types of ML models such as regression models, random forests and neural networks are built and applied to the training data. Models are iterated on by making small adjustments to their parameters in order to improve their performance with the goal of generating the most accurate predictions possible.
- Evaluate model on the test dataset. The top performing model is used on the testing data to get a sense of how the model will perform on real world data it’s never seen before. Based on the results, further refinement and tuning of the model may be needed.
- Make predictions! Once the model is finalized, it can begin to be used to answer the question it was designed for.
Sources of bias
There are two key ways bias can be introduced and amplified during the machine learning process: by using non-representative data and while fitting and training models.
Biased data
Data that are non-representative and biased.
When one examines a data sample, it is imperative to check whether the sample is representative of the population of interest. A non-representative sample where some groups are over- or under-represented inevitably introduces bias in the statistical analysis. A dataset may be non-representative due to sampling error and non-sampling errors.
Sampling errors refer to the difference between a population value and a sample estimate that exists only because of the sample that happened to be selected. Sampling errors are especially problematic when the sample size is small relative to the size of the population. For example, suppose we sample 100 residents to estimate the average US household income. A sample that happened to include Jeff Bezos would result in an overestimate, while a sample that happened to include predominantly low-income households would result in an underestimate.
Population mean: $0
Non-sampling errors are typically more serious and may arise from many different sources such as errors in data collection, non-response, and selection bias. Typical examples include poorly phrased data-collection questions, web-only data collection that leave out people who don’t have easy access to the internet, over-representation of people that feel particularly strongly about a subject, and responses that may not reflect one’s true opinion.
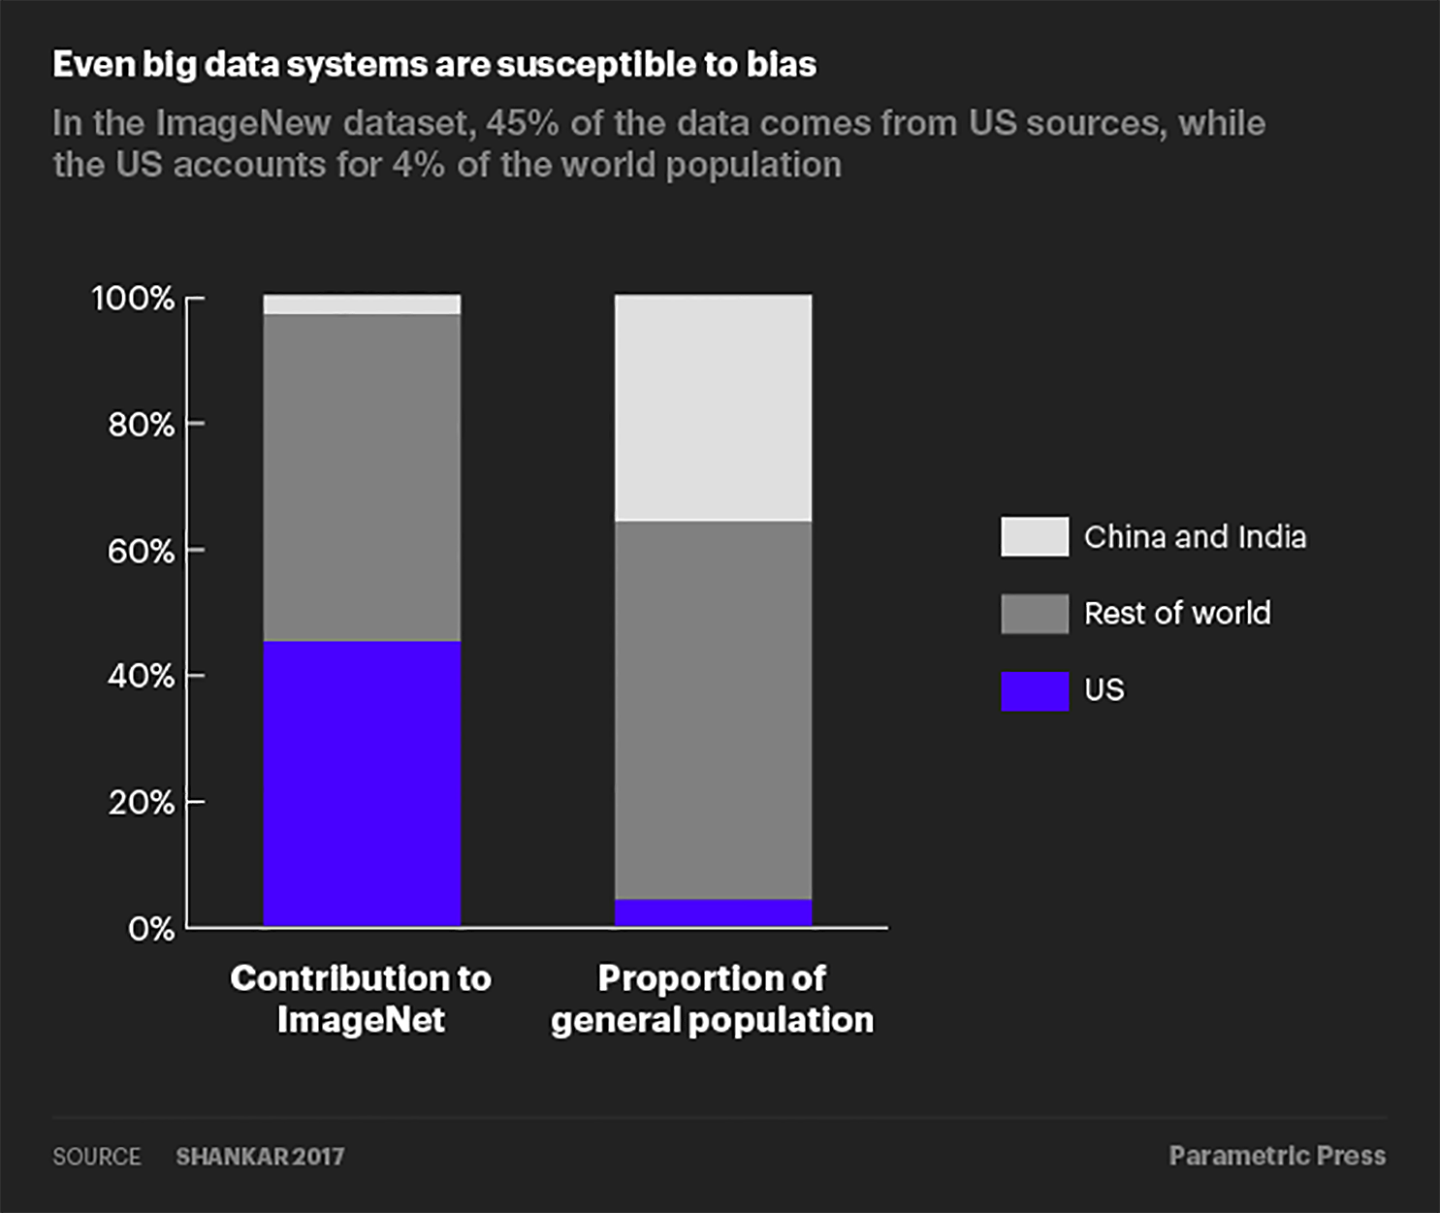
Even big data are susceptible to non-sampling errors. A study by researchers at Google found that the United States (which accounts for 4% of the world population) contributed over 45% of the data for ImageNet, a database of more than 14 million labelled images. Meanwhile, China and India combined contribute just 3% of images, despite accounting for over 36% of the world population. As a result of this skewed data distribution, image classification algorithms that use the ImageNet database would often correctly label an image of a traditional US bride with words like “bride” and “wedding” but label an image of an Indian bride with words like “costume”.
Data that are representative but still biased.
What if a dataset is representative of its target population? No more worries about bias coming through the data, right? Not so fast—a representative dataset may still be biased to the extent that it reflects any historical social bias. A recruiting algorithm once used by Amazon was found to have disproportionately favored male candidates. The data used to train the algorithm were based on resumes collected over a 10-year period.
Because the tech industry was historically dominated by men, a majority of the resumes were submitted by men. Therefore, even though the dataset was “representative” of the historical applicant pool, it captured the inherent gender bias and passed it on to the recruiting algorithm. Representative but biased data is in some sense a more problematic issue than non-representative data since fixing the former would require addressing biases that are inherent in society.

Biases that are amplified through algorithms
Machine learning algorithms themselves may amplify bias if they make predictions that are more skewed than the training data. Such amplification often occurs through two mechanisms: 1) incentives to predict observations as belonging to the majority group and 2) runaway feedback loops.
Algorithms incentivized to predict the majority group.
In order to maximize predictive accuracy when faced with an imbalanced dataset, machine learning algorithms are incentivized to put more learning weight on the majority group, thus disproportionately predicting observations to belong to that majority group. The next interactive example illustrates this tendency.
Suppose we have an image-classification algorithm tasked with identifying the gender of the person in a given image. The training dataset contains 10 cooking images; each image shows either a man or a woman in the kitchen. This dataset may range from a balanced, unbiased sample (five images showing men, five images showing women) to a completely biased sample (all 10 images showing either women or men).
Having unbiased training data is the ideal scenario, but in a more realistic setting, women are likely to be over-represented in a sample of cooking images. Suppose the training dataset contains eight images of women cooking and two images of men and that the model has a 70% predictive accuracy (i.e., a bias of 80/20 and model accuracy of 70% in the interactive below). When this data is fed through the model, the model correctly labels the gender of six of the photos of women and one of the photos of a man while mistaking the gender of the remaining three photos (30% error rate).
If the model were to instead simply predict that every cooking image is of a woman, it would lower its error rate to 20% because it has correctly labeled all of the photos with a woman while only mistaking the gender of the two photos of men. In pursuit of higher predictive accuracy, the model has amplified the bias from 80% women in the training data to 100% women in the model prediction.
Play with the bias and model accuracy settings below to see how different mixes affect the tendency for the model to amplify bias. For a given level of predictive accuracy, how does the tendency for the model to amplify bias change with the amount of bias in the data, and vice versa? When is the model incentivized to amplify bias, and when it is not?
Runaway feedback loops.
In the previous image-classification example, bias amplification stops at the model prediction stage. However, in machine learning models where the prediction is fed back into the model as inputs for the next round of predictions, bias can be amplified further in the form of a feedback loop.
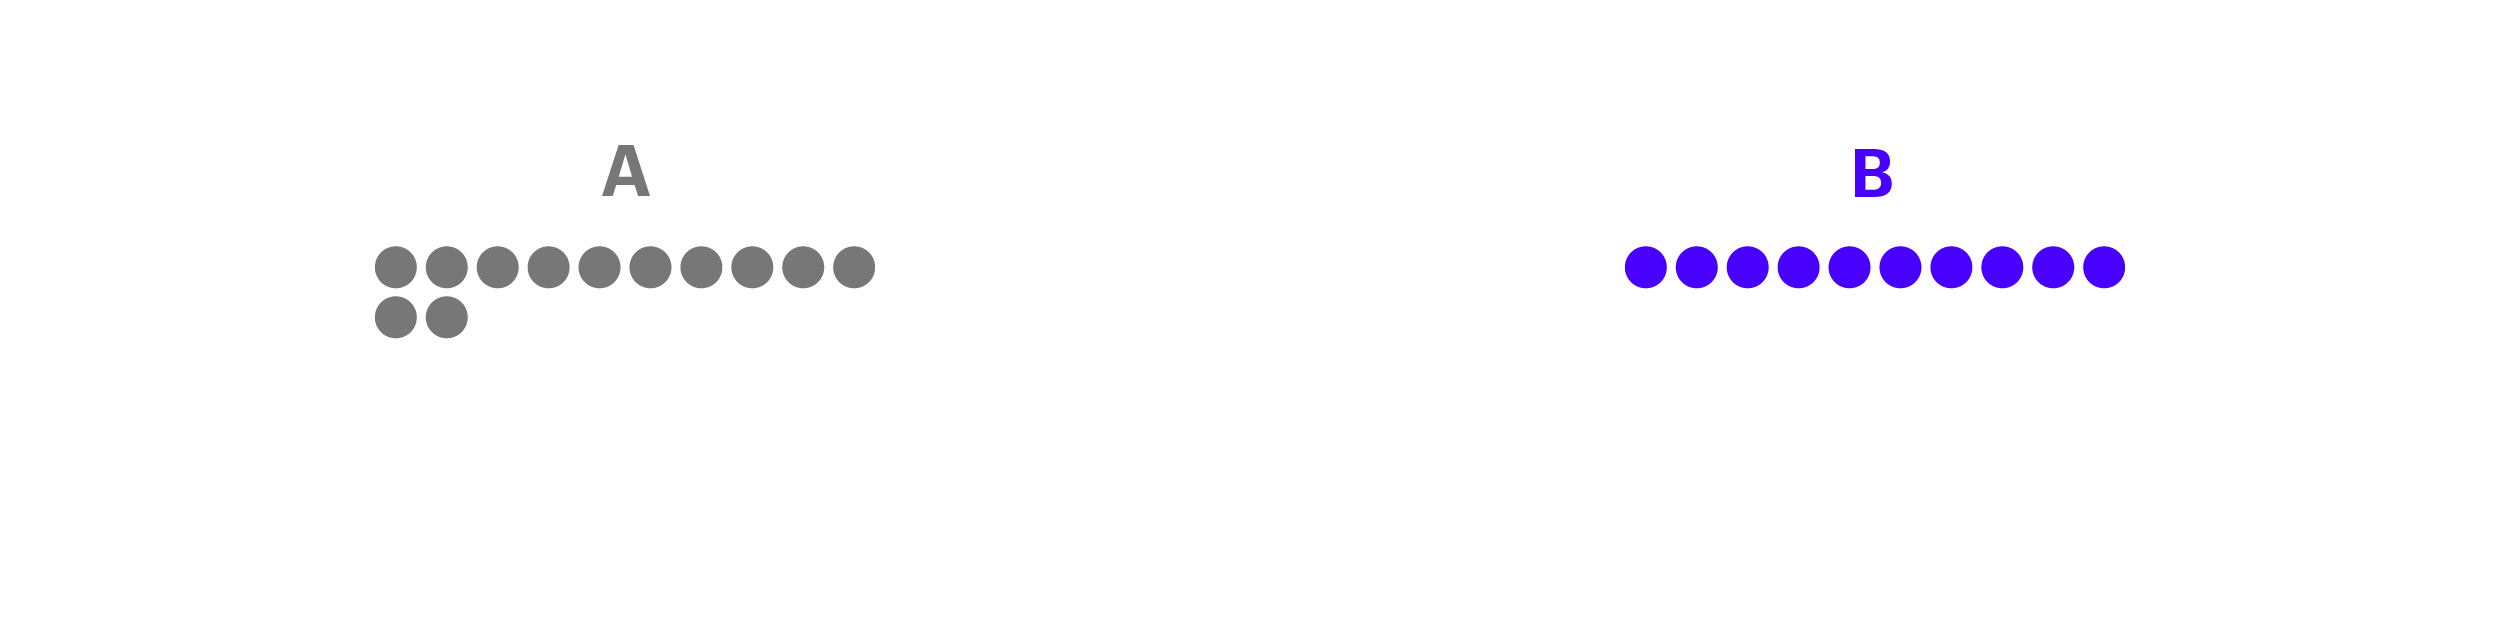
Consider a predictive policing algorithm used to determine the optimal allocation of police force across a city. Suppose the city has two precincts (A and B) and one policeman, John. The city wishes to use historical data on past crime occurrences to determine to which precinct to dispatch John. The goal is to send John to each precinct in propotion to the frequency of crimes that occur in each precinct. If 40% of crimes occur in precinct A, the algorithm should send John to patrol A 40% of the time.
In our example, let’s say the city experienced a total of 22 crimes in the past year, with 12 of those occurring in precinct A and 10 in precinct B, as shown below:
The predictive algorithm uses this historical data to determine where to send John. The likelihood that the algorithm will dispatch John to precinct A is in proportion to the share of all crimes that occurred in A. In this case, this probability is 12/22 = 54.5%. The algorithm will choose to send John to precinct B with a probability of 10/22 = 45.5%.
Let’s say the algorithm decides to dispatch John to patrol precinct A. While there, John encounters three crimes and logs them in the system. The updated data now show a total of 15 past crimes in A and 10 in B. However, because no one was sent to precinct B, crimes that occured in B on the same day were not captured in the data.
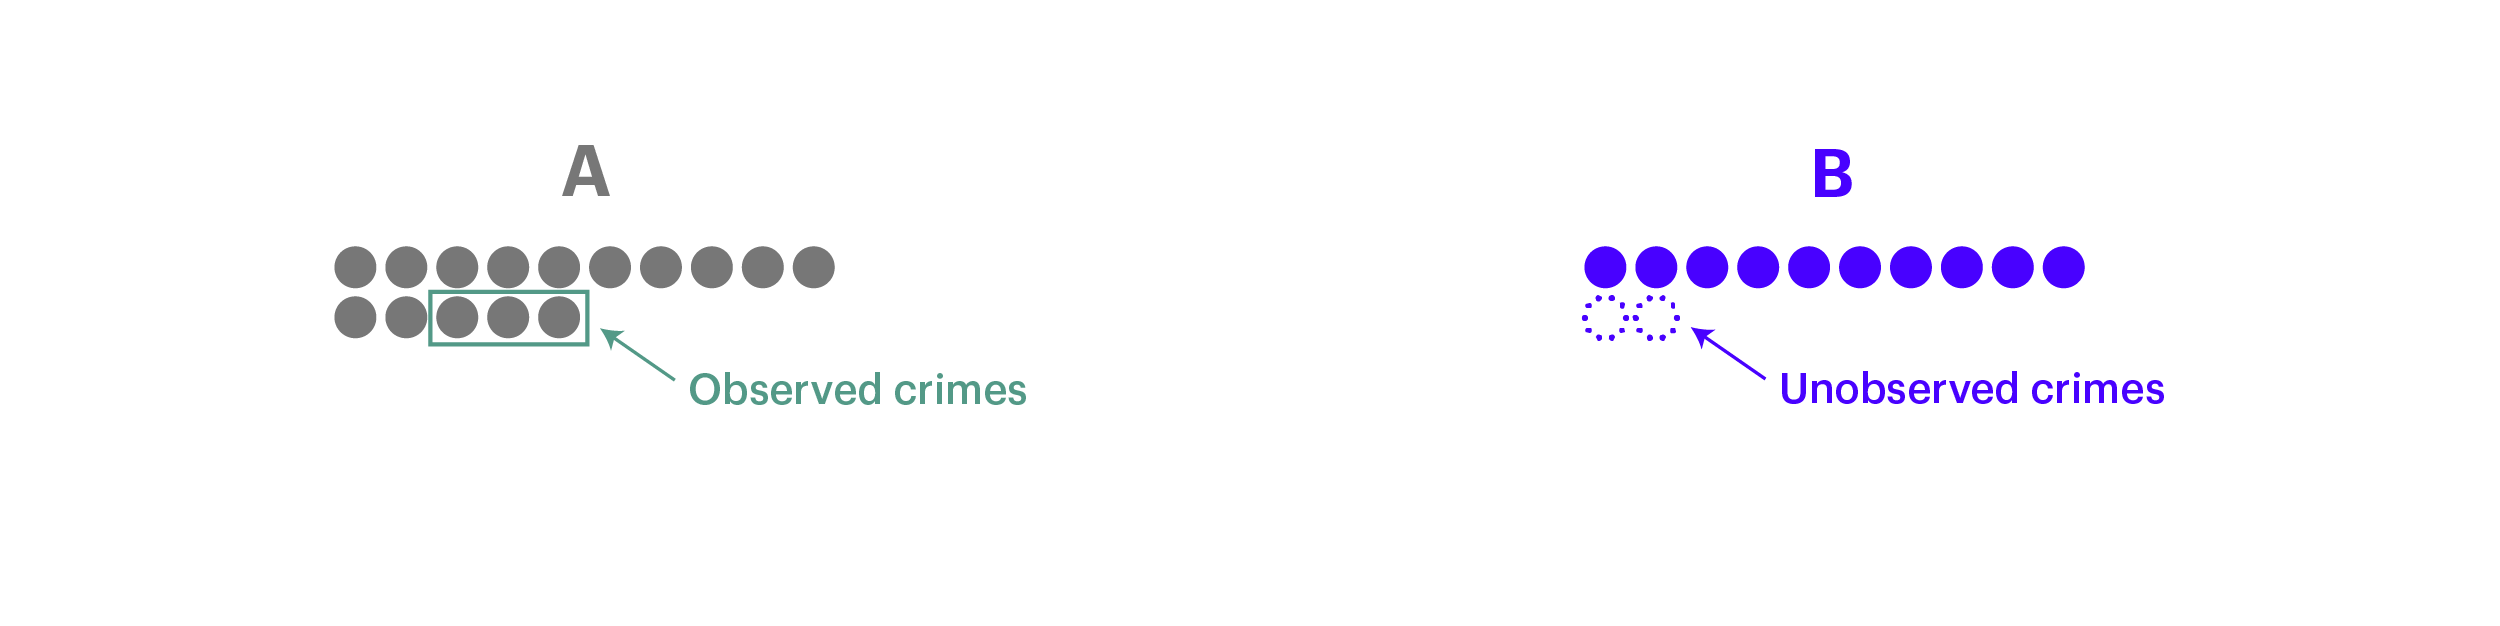
The next day, when the algorithm decides where to send John to, it will have a 15/25 = 60% probability of sending John to A and 10/25 = 40% probability of sending him to B. The algorithm now has an even higher likelihood of sending John to precinct A as a result of its decision to assign John to A yesterday. When the model chooses to send John to precinct A, more instances of crime will be logged for precinct A, while crime that occur in B are ignored and remain uncaptured in the data.
Over time, the data will become increasingly distorted, with the gap between the observed crime ratio and the actual crime ratio of the two precincts widening due to the decisions the model makes.
Feedback loops are especially problematic when sub-groups in the training data exhibit large statistical differences (e.g. one precinct has a much higher crime rate than others); a model trained on such data will quickly “run away” and make predictions that fall into the majority group only, thereby generating ever-more lopsided data that are fed back into the model.
Even when sub-groups are statistically similar, feedback loops can still lead to noisy and less accurate predictions. Algorithms where the predictive outcome determines what feedback the algorithm receives—e.g. recidivism prediction, language translation, and social media news feeds—should always be diligently monitored for the presence of feedback loops bias.
Bias in data and in algorithms are interrelated
It should be clear by this point that bias in data and algorithms are interrelated. When an algorithm is fed training data where one group dominates the sample, it is incentivized to prioritize learning about the dominant group and over-predict the number of observations that belong to the dominant group. This tendency is exacerbated when the model’s predictive accuracy is relatively low. Conversely, if the data were balanced relative to the predictive accuracy, the model would have nothing to gain by over-predicting the dominant group.
Bias can also be perpetuated through a feedback loop if the model’s own biased predictions are repeatedly fed back into it, becoming its own biased source data for the next round of predictions. In the machine learning context, we no longer just face the risk of garbage in, garbage out—when there’s garbage in, more and more garbage may be generated through the ML pipeline if one does not monitor and address potential sources of bias.
How people are tackling bias
How does one actually tackle bias in the ML pipeline? While a suitable fix depends on each specific circumstance, here are some ways that companies and researchers are trying to reduce bias in machine learning.
1. De-biasing data
One key to de-biasing data is to ensure that a representative sample is collected in the first place. Bias from sampling errors can be mitigated by collecting larger samples and adopting data collection techniques such as stratified random sampling. While sampling errors won’t go away entirely, rapid data growth—2.5 quintillion bytes per day and counting—and growing data collection capability have made it easier than ever to mitigate sampling errors compared to the past.
Bias from non-sampling errors are much more varied and harder to tackle, but one should still strive to minimize these kinds of errors through means such as proper training, establishing a clear purpose and procedure for data collection, and conducting careful data validation. For example, in response to the image-classification database that contained disproportionately few wedding images from India, Google deliberately sought out contributions from India to make the database more representative.
What about data that are representative but reflect bias inherent in the population? For datasets that contain minority groups, one can oversample those minority groups to create a more balanced training dataset. For datasets that may contain biased associations, one can first quantify and remove any biased associations from the dataset before proceeding to the model training and prediction stages.
Word2Vec is a model that can be used to quantify relationships between words. De-biasing Word2Vec data is an example of this latter approach: researchers first measured how closely two words relate to each other along the gender dimension and assessed whether different strengths of association reflect gender bias or appropriate relationships.
For example, the fact that “female” is more closely related to “homemaker” as opposed to “computer programmer” is indicative of gender bias, whereas a close association between “female” and “queen” reflects an appropriate, definitional relationship. The researchers then implemented a separate algorithm to neutralize gender association between word pairs exhibiting gender bias before feeding this de-biased data into the Word2Vec embedding algorithm.
2. De-biasing algorithms
In addition to de-biasing the data, one can apply model interventions to directly offset algorithms’ tendency to amplify bias. One intervention method is to impose model constraints that specify the statistical distribution of predictions. For example, researchers have been able to reduce bias amplification in image-labeling algorithms nearly 50% by adding model constraints that required the proportion of images predicted to be male versus female to fall within 5% of the ratio observed in the training dataset. This approach can be particularly useful for reducing bias amplification when one is using imbalanced training datasets.
Another intervention method that is particularly useful to combat feedback loops is to impose sampling rules that specify how outputs generated from model predictions should be fed back into the algorithm. Going back to the predictive policing example, instead of letting every newly observed crime instance be fed back into the algorithm, one can impose a sampling rule such that the more likely police are sent to a particular precinct, the less likely data observed from those assignments are incorporated into the algorithm. These sorts of sampling rules help prevent models from making predictions that disproportionately fall to one particular group.
3. Evaluating performance against alternative metrics
For algorithms that make classification decisions among different groups, it is also important to consider the performance of the model against metrics other than accuracy—for example, the false positive rate or false negative rate.
For example, consider a criminal-justice algorithm used to assign risk scores for recidivism to defendants. Someone is labeled as “high risk” if they have a ⅔ predicted chance of reoffending within two years. Suppose the training data only contain two groups: Group A and Group B; each group has a different underlying profile for recidivism. In this example, possible alternative model metrics would be:
- False positive rate: the probability of labeling someone as high risk, even though they did not reoffend.
- False negative rate: the probability of labeling someone as low risk, even though they did reoffend.
One can then apply model constraints to make the algorithm satisfy some fairness rule. Common rules include1:
Google Research (2016), Attack discrimination with smarter machine learning.
Gorbett-Davis and Goel (2018), The Measure and Mismeasure of Fairness.
- Predictive parity: Let algorithms make predictions without considering characteristics such as gender and race. In the recidivism example, white and black defendants would be held to the same risk scoring standards.
- Well-calibrated: In situations with more than one predicted outcome (for example, risk scores on a scale of one to nine instead of simply high versus low risk), this would mean the proportion predicted to reoffend is the same across groups for every possible score value.
- Error rate balance: Requiring that certain performance measures be held equal across groups. In the recidivism example, the algorithm would be required to achieve the same false positive rate or the same false negative rate across groups A and B.
In the simplified recidivism model below, the predictive parity rule has been imposed such that for both groups, 67% of people that are labeled as “high risk” indeed get rearrested. Play with the model by setting the total number of people in Group A that are labeled as “high risk”. Can you set this number such that the model achieves equal false negative rates in addition to predictive parity? Is there a value that allows the model to achieve equal false positive and false negative rates and predictive parity?
| Low Risk | High Risk | Total | |
| Doesn't Reoffend | 60 | 10 | 70 |
| Reoffends | 10 | 20 | 30 |
| Total | 70 | 100 |
| Low Risk | High Risk | Total | |
| Doesn't Reoffend | 20 | 20 | 40 |
| Reoffends | 20 | 40 | 60 |
| Total | 40 | 60 | 100 |
| Group A | Group B | |
| Accuracy: | 67% | 67% |
| False Positive Rate: | 14% | 50% |
| False Negative Rate: | 33% | 33% |
4. Going beyond data and algorithms
Beyond tackling bias directly in the data and / or the algorithm, there are broader measures that tech companies in particular have begun to adopt. One measure is to establish ethical AI guidelines, where minimizing bias is included as part of a company’s overarching AI objectives. (As ML is a subset of AI, the same ethical guidelines would then apply to ML product developments as well.) Google explicitly lists “Avoid creating or reinforcing unfair bias” as the second principle for AI applications. Microsoft similarly includes “AI systems should treat all people fairly” among its AI principles.
Another measure is to conduct third-party algorithm audits to ensure each AI product satisfies a company’s AI guidelines; a growing number of data analytics and consulting firms are starting to offer such auditing services. An even broader measure that targets the human source is to promote diversity in the AI / ML workforce. As of 2018, only 13% of AI CEOs are women, and less than 7% of tenure-track engineering faculty identify as either African American or Hispanic. Black in AI and AI4ALL are budding examples of initiatives to change the current landscape by fostering a more diverse and inclusive community of AI / ML practitioners.
While these measures alone do not eliminate bias completely from machine learning, they do reflect how companies and the broader AI / ML community are increasingly aware of the need to address bias as such technologies become ever-more widely used.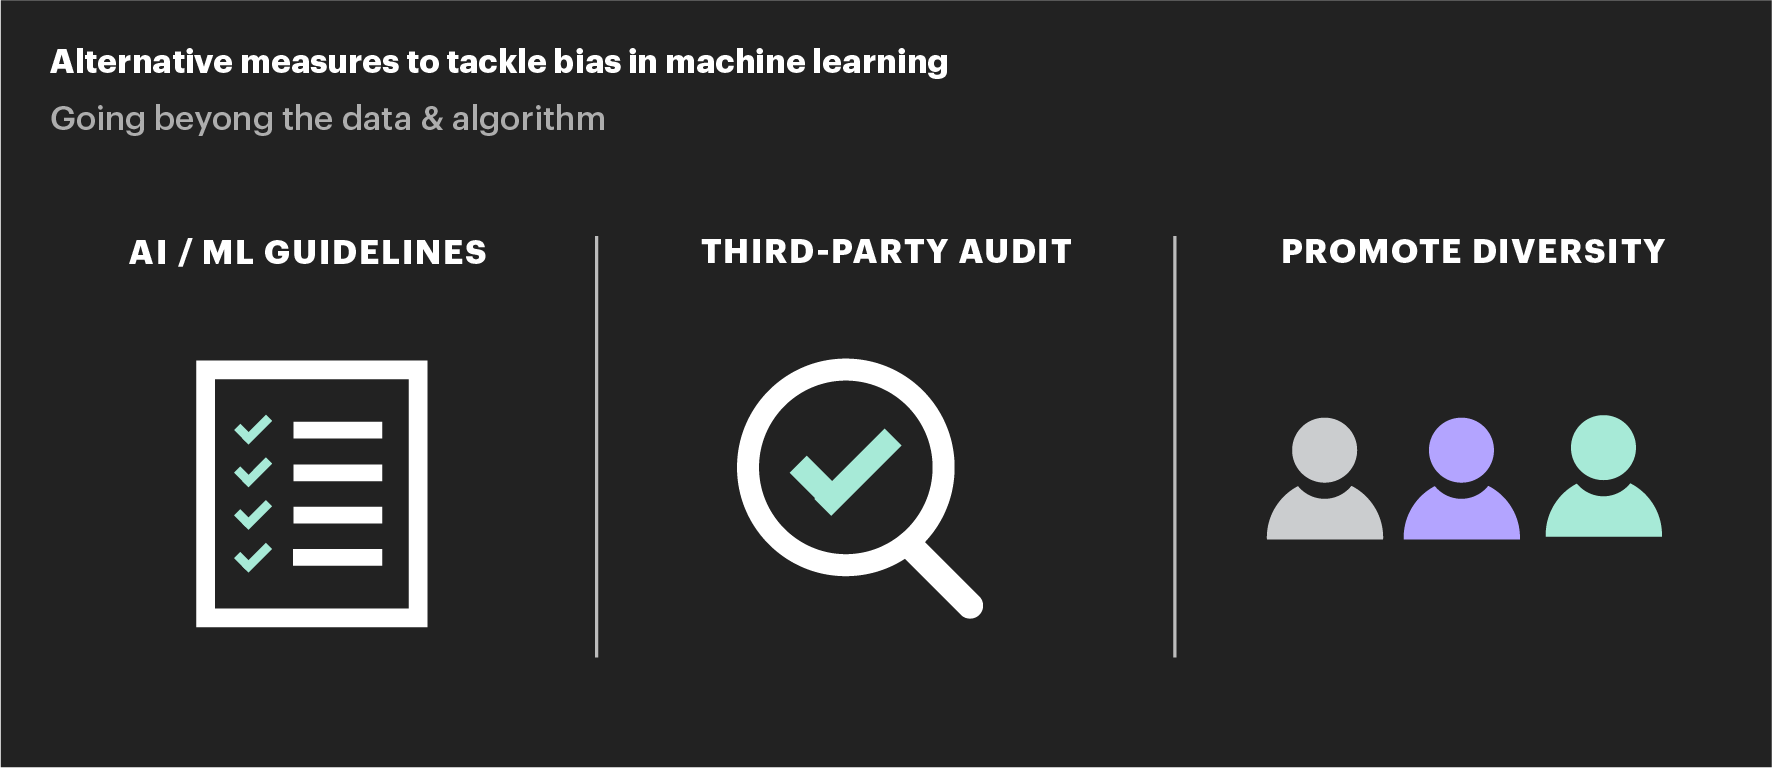
Conclusion
Challenges to addressing bias in machine learning
While the previous section mentioned approaches that can be taken to mitigate bias in ML, truly eliminating such disparities is a more challenging problem than it may appear at first glance. Collecting data that perfectly represent all subgroups in a population, while certainly helpful, is not a panacea. If the underlying systems being modeled are themselves unjust (e.g., minority neighborhoods tend to be disproportionately policed, poor and minority families are more likely to be reported to child abuse hotlines, hiring managers may prefer men over women for software engineering roles), then the model results will still end up reflecting these biased behaviors. Conversely, removing bias from ML, though it may generate less ethically troubling results, will not fix the underlying social injustices either.
Another challenge is pinpointing exactly what a “fair” outcome means. Going back to the recidivism example, is it that the model is equally good at predicting which groups of defendants will commit another crime (predictive parity) even if the model incorrectly labels more defendants from Group B as likely to reoffend? Or should the goal be that the model incorrectly predicts which defendants will reoffend at equal rates between the two groups (equal false positive rates)? Or that the model fails to catch reoffenders at the same rate between the two groups (equal false negative rates)? All are valid ways to define “fairness”, yet it has been proven to be mathematically impossible to satisfy all of these conditions simultaneously. Trying to be fair in one way necessarily means being unfair in another way.
Furthermore, optimizing to these definitions can impose other social costs. Training a model to be unbiased in predicting who will reoffend can lead to an increase in violent crime rates because more high-risk defendants are set free. Thus there are tensions between balancing social welfare (e.g., public safety) with algorithmic fairness (e.g., minimizing the needless imprisonment of harmless individuals).
A further wrinkle is that sometimes what may be considered as biased in some situations may be exactly the outcome desired in other instances. For example, someone looking to study the proportion of male versus female characters that appear in English-language novels over the past several hundred years would want their algorithm to detect gender associations found in occupations in order to identify the sex of that character. Such “bias” is critical for this type of analysis yet would be entirely problematic if the model was instead designed to screen resumes for job postings.
What can be done to fix the situation?
Lest the situation seem hopeless, there are steps that companies and organizations can take to improve the results of their modeling efforts. One such step is to make sure the group working on ML problems is diverse in terms of understanding people from different socio-economic environments so that as many viewpoints as possible are represented. In addition, employees should be trained on identifying their own biases in order to increase their awareness of how their own assumptions and perceptions of the world influence their work.
Another important point is being transparent and open about what, exactly, a ML model does, how it arrived at the results it did, and what accuracy metrics did it is optimize for. Being able to explain why the model predicted, for example, someone as not being creditworthy not only allowsthat individual to understand what happened, but also makes it easier to identify problems in the model’s performance. Finally, acknowledging that ML is not a magical solution that will solve all of the world’s problems but, like any other tool, has its limitations and weaknesses will help with maintaining a more realistic perspective on what these models can (and cannot) achieve. Microsoft and Google have recently begun including warnings about the risks of using AI in their Securities and Exchange Commission filings.
Algorithms are being used to recommend what to watch next on Netflix, filter out spam from inboxes, and offer directions that help drivers avoid traffic. They are also being used to determine whether parole should be granted, which neighborhoods should be policed more heavily, if children are being abused, and who should be hired. The stakes are real when it comes to how decisions made by ML and AI models are impacting people’s lives and if trends continue, these algorithms will be increasingly relied on to help make these decisions.
Bias in machine learning imposes serious costs on both individuals and society as a whole by unfairly denying people opportunities while perpetuating stereotypes and inequities. Tackling bias is a challenging problem for which there are no simple solutions or clear cut answers. But it is imperative that ML practitioners do so by using more representative data, evaluating results against various different definitions of accuracy and being more aware of their own biases. ML and AI will indeed change the world; let’s make sure they change the world for the better.